The Magnificent Seven stocks (Microsoft, Apple, Alphabet, Amazon, Nvidia, Meta, and Tesla) have been the largest driver of equity returns in recent years and were again the dominant contributors in 2023, accounting for more than half of the market increase.

First, we take a look back at the change to the US stock market, from FANG to The Magnificent Seven.
CNBC personality Jim Cramer is credited with coming up with the popular FANG acronym to describe Mega Cap tech growth stocks Facebook, Amazon, Netflix and Google way back in 2013. Since then, Facebook changed its name to Meta, and Google restructured and changed its corporate name to Alphabet. Cramer expanded FANG to FAANG in 2017 when he added Apple to the mix.
In 2023, Bank of America analyst Michael Hartnett identified a new group of stocks and named them the “Magnificent Seven.” Those stocks delivered an average return of 112% last year, which significantly outperformed the 24% gain in the S&P 500 index.

Generative AI Boosting the Magnificent Seven
Did you know the Magnificent Seven moniker has its origins in the classic 1960 western film “The Magnificent Seven” starring Steve McQueen and Yul Brynner, which is itself a remake of Akira Kurosawa’s “Seven Samurai”. In the movie, the farmers in a poor village hire rogue gunfighters to protect them from marauding outlaws who raid their village and take their hard-earned food and provisions.
In much the same vein, investors have flocked en massee to the Magnificent Seven stocks in recent years not only for their attractive expected long-term growth, but also for their potential protection from the erosion of purchasing power due to inflation. This broad appeal has driven significant outperformance for those stocks over time; that was again the case in 2023 and continues so far in 2024.
The term artificial intelligence (AI) was initially coined and came into popular use in 1950 when Alan Turing published “Computer Machinery and Intelligence” which proposed a test of machine intelligence called The Imitation Game. Fast forward to 1997 for another memorable tech headline when the IBM computer named “Deep Blue” beat world chess champion Garry Kasparov.
Generative AI refers to AI systems capable of generating new content, designs, or solutions based on input data or patterns learned from data. This technology has the potential to revolutionize industries by automating creative tasks, enhancing efficiency, and unlocking new possibilities for innovation.
Generative AI focuses on creating new content and data while traditional AI solves specific tasks with predefined rules. Generative AI uses unsupervised learning and generative models while Traditional AI often employs supervised learning and discriminative models.
Generative AI holds enormous potential for enhancing the productivity and profitability of tech stock companies including the Magnificent Seven. By leveraging AI for data analysis, personalized customer experiences, content generation, art, design, music creation, drug and disease research and more, these companies may stay at the forefront of innovation and should gain a competitive advantage in their respective industries.
Concentration Risk Elevated
Market share and market concentration can be measured in a number of ways. The Herfindahl-Hirschman index (HHI) is one of the most popular methodologies and is widely used to measure market concentration and competitiveness by assessing the size of individual companies relative to the overall size of their industry. The same methodology can be applied to market shares within the equity market, comparing individual company market caps to the overall capitalization of the market to arrive at a measure of market concentration.
The below chart from JPMorgan uses the HHI to calculate the relative concentration of the S&P 500 over the last 60 years. The significant increase in market concentration can be seen in the steeply rising blue line since 2016. After a pause in 2022, market concentration is now at its highest level since the early 1970s when the Nifty Fifty stocks dominated the U.S. stock market and is well in excess of the prior tech bubble ending in 2000.

While illustrative of the overall trend in market concentration, the HHI arguably understates the true degree of market concentration within the U.S. equity market. The below chart shows the weight of the 10 largest stocks in the S&P 500 compared with the weight of the 11-50th largest stocks. The two lines historically have moved together as broad themes play out in the market. As can be seen below, however, the divergence between the two groups is significant since 2016, with the weight of the 10 largest stocks nearing its highest level since the 1970s, while the weight of the 11-50th largest stocks is no higher than average.

Trillion-Dollar Companies
The table below lists all companies which have, at any point, had a market capitalization in excess of $1 trillion, the date on which their market cap first exceeded $1 trillion and their record market cap.

https://en.wikipedia.org/wiki/List_of_public_corporations_by_market_capitalization
12 Global Titans – US Leads Innovation

Aramco, TSMC and Novo Nordisk are the only 3 non-US Companies.
What does the future hold?
It is beyond the scope of this post to assess what the road ahead may look like. That said, looking at prior episodes of market concentration and the tally of the largest companies in those markets can be illustrative of long-term relative performance. The below table lists the largest companies in the S&P 500 by decade, starting with 1980 and continuing through the present. While there are some stalwarts with multiple appearances over the decades (Microsoft, ExxonMobil), change in the composition of the top 10 companies is the norm.


The bottom line
After trading together for much of 2023, the market is beginning to take note of the changes underway, with a sharp divergence in the fortunes of the Magnificent Seven over the past four months. Ultimately, the returns of the Magnificent Seven stocks in the long run will be driven by the underlying performance of their individual operating models. While making no prediction about the specific companies here, will active managers be able to differentiate the relative prospective returns of each and position their portfolios accordingly?
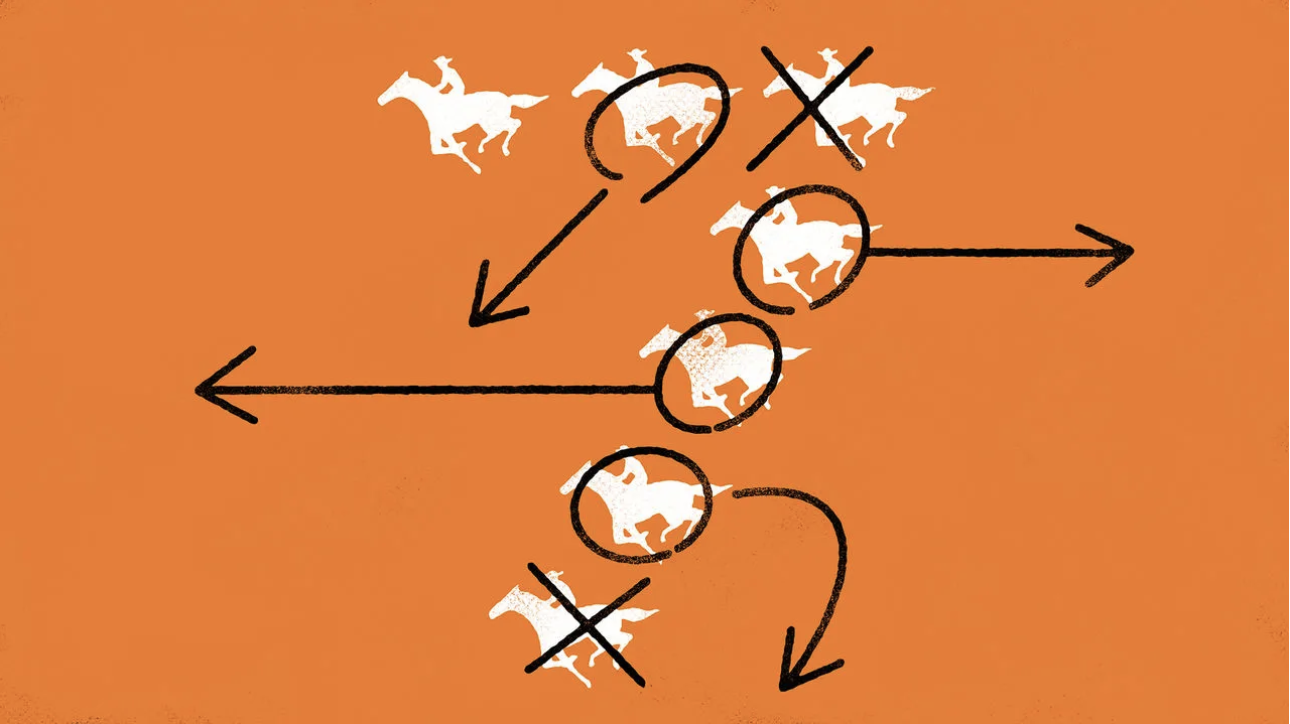
It is often said that diversification is the only free lunch in markets. Investors would be well served to remember that in “The Magnificent Seven”, only three of the seven gunslingers make it out of the final battle alive.
References:
https://russellinvestments.com/us/blog/market-concentration-magnificent-seven